Attention
Example
The MiRNA-BD has been successfully applied to identify miRNA biomarkers for pediatric acute myeloid leukemia (AML) (Yan, et al., 2015). Here we use the same dataset as the running example. The User Guide and datasets can be obtained from the "Home" page.
The miRNA (GSE35320)(Daschkey, et al., 2013) and mRNA dataset (GSE43176)(Xu, et al., 2013) were downloaded from NCBI GEO datasets directly. We selected the DE-miRNAs and DE-mRNAs (p-value<0.05), and saved them in two text files below:
Example_GSE35320_DEmiRNAList.txt
Example_GSE43176_DEmRNAList.txt
Step_1: Since the unpaired miRNAs and mRNAs, we introduce the steps of AML-specific network construction as follows:
1) Choose the construction mode and input the DE-miRNA and DE-mRNA list. (see Figure 1-5).
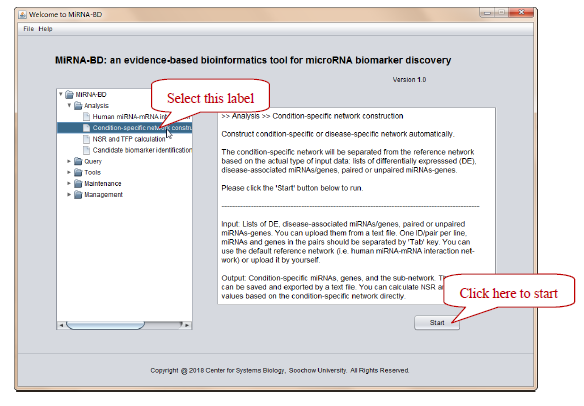
Figure 1. Double click “MiRNA-BD.jar” -> Select “Condition-specific network construction” label -> Click “Start”
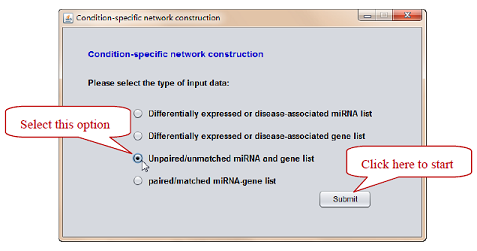
Figure 2. Select the type of input data: based on unpaired miRNA and gene list.
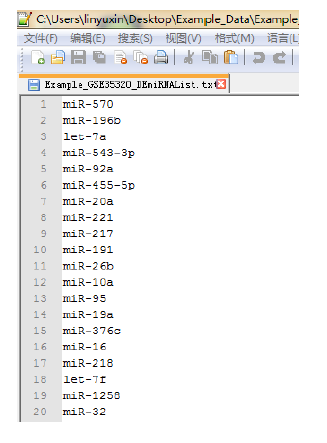
Figure 3. The format of input DE-miRNA list, text file only, per miRNA per line.
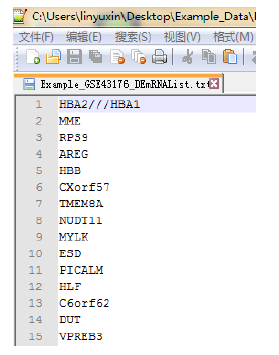
Figure 4. The format of input DE-mRNA list, text file only, per mRNA per line.
2) Select the reference miRNA-mRNA network, i.e. the default is chosen as an example. (see Figure 5).
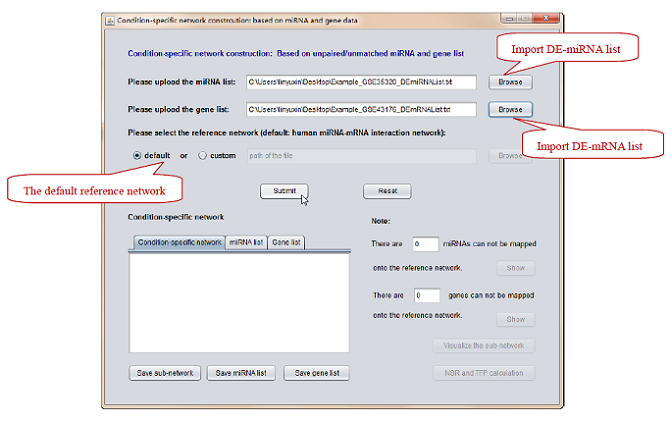
Figure 5. Input DE-miRNA and DE-mRNA list -> Select the “default” reference network.
3) Construct the AML-specific network based on the input data. (see Figure 6).
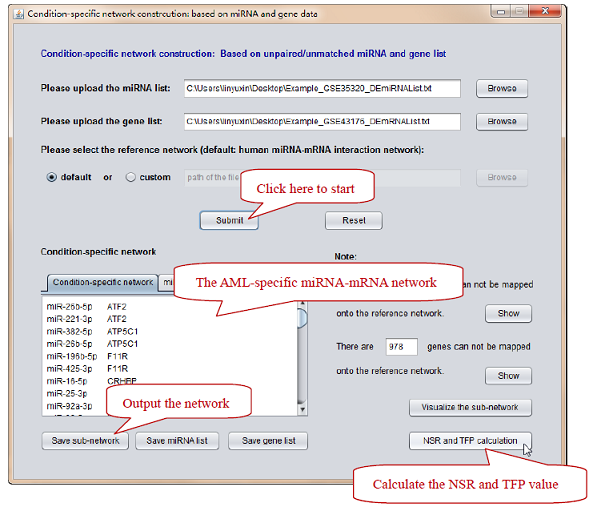
Figure 6. Click “Submit” button -> Click “NSR and TFP calculation” button. Please do not forget to normalize miRNA IDs when the program reminds. The constructed network as well as the AML-specific miRNA and gene list can be outputted.
Step_2: Calculate NSR and TFP values.
Here, we calculate NSR and TFP values for each miRNA in AML-specific network (see Figure 6-7).
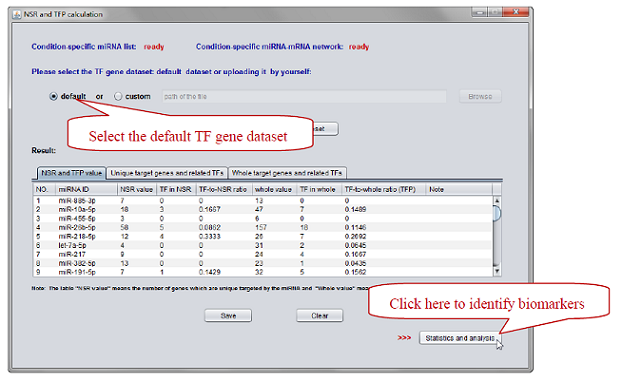
Figure 7. Select the “default” TF gene dataset -> Click “Submit” button -> Click “Statistics and analysis” button.
Please note that the operation may take several minutes because it processes the data of each miRNA in AML-specific network one by one. Outputs can be found in the “Result” table. All the information in the table can be exported.
Step_3: Identify candidate miRNA biomarkers.
The program identifies candidate miRNA biomarkers based on the following steps:
1) Select miRNAs with significantly high NSR values;
2) Select miRNAs with significantly high TFP values from those achieved in Step 1).
You can click the button “Statistics and analysis” (see Figure 7) after NSR and TFP values are calculated. MiRNA-BD quantifies the “high” based on Wilcoxon signed-rank test. Do not forget to modify the thresholds if it is necessary (see Figure 8-9).
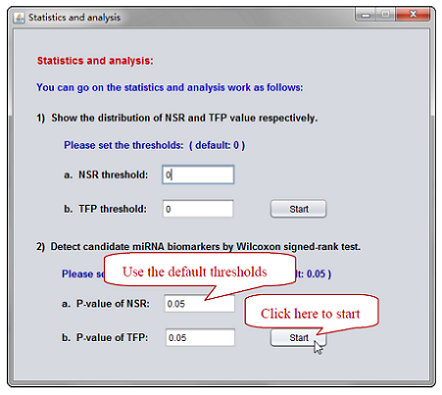
Figure 8. Select the "default" thresholds -> Click “Start” button.
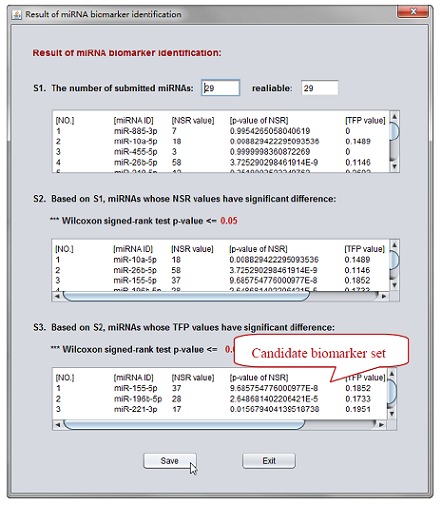
Figure 9. The final result.
Result: Finally, three miRNAs are screened as candidate biomarkers (i.e. miR-155-5p, miR-196b-5p, miR-221-3p) based on the pipeline above. The reconstructed reference network is used and the result indicate that two (miR-155-5p, miR-196b-5p) of the three outliers are the same as in our previous study (Yan, et al., 2015).
We noticed that two miRNAs in the result, i.e. miR-155-5p and miR-196b-5p, were significantly overexpressed in children with AML and subgroup M4-M5 respectively (Yan, et al., 2015). Meanwhile, the remaining one, miR-221-3p, was also associated with AML according to literature reports (Cammarata, et al., 2010; Rommer, et al., 2013).
References
Cammarata, G., et al. (2010) Differential expression of specific microRNA and their targets in acute myeloid leukemia, American journal of hematology, 85, 331-339.
Daschkey, S., et al. (2013) MicroRNAs distinguish cytogenetic subgroups in pediatric AML and contribute to complex regulatory networks in AML-relevant pathways, PloS one, 8, e56334.
Rommer, A., et al. (2013) Overexpression of primary microRNA 221/222 in acute myeloid leukemia, BMC cancer, 13, 364.
Xu, J., et al. (2013) Dominant role of oncogene dosage and absence of tumor suppressor activity in Nras-driven hematopoietic transformation, Cancer discovery, 3, 993-1001.
Yan, W., et al. (2015) MicroRNA biomarker identification for pediatric acute myeloid leukemia based on a novel bioinformatics model, Oncotarget, 6, 26424-26436.